Brent Butler
Welcome to my portfolio! I have always loved the surprising insights data can help us see. It can help you question your assumptions, or affirm your uncertainties. Data has the potential to tell a story better than a book, or capture a moment in time better than a photo. It is my mission to help further those possibilities. I have a particular affinity for geographic and spatial data, because I am continually interested in the intersection of people and place. Below you will find my personal Data Science projects, please reach out with any questions, comments, or recommendations. I'd love to talk about anything that is Data!
Projects
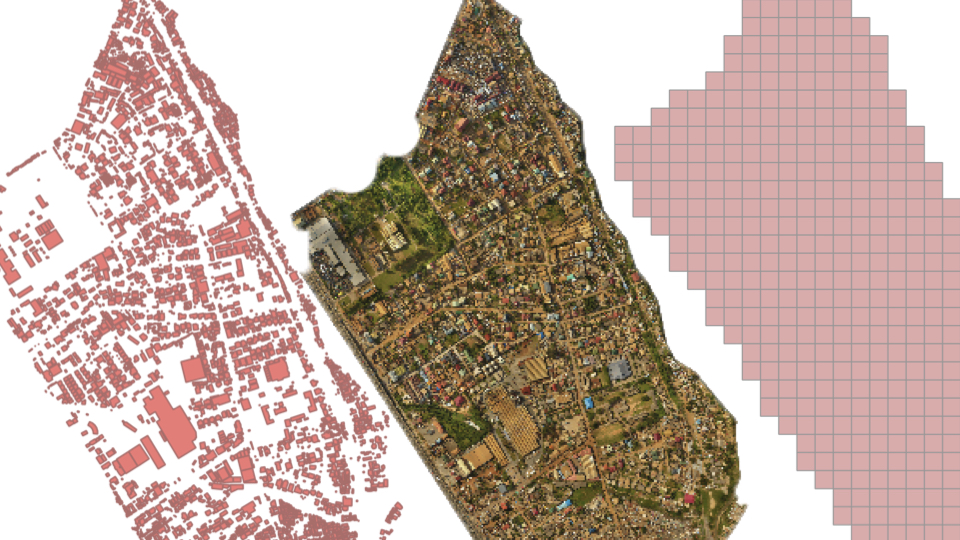
FastMap.ai
5 year returns
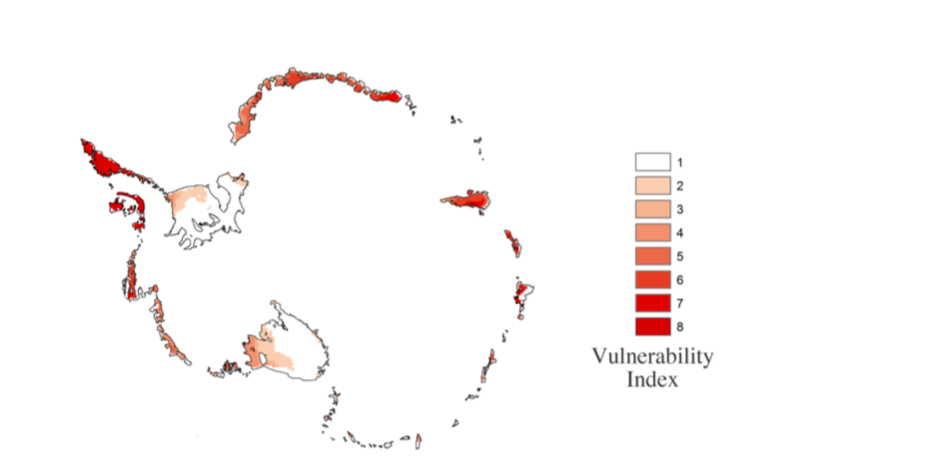
Antartic Ice Shelf vulnerability
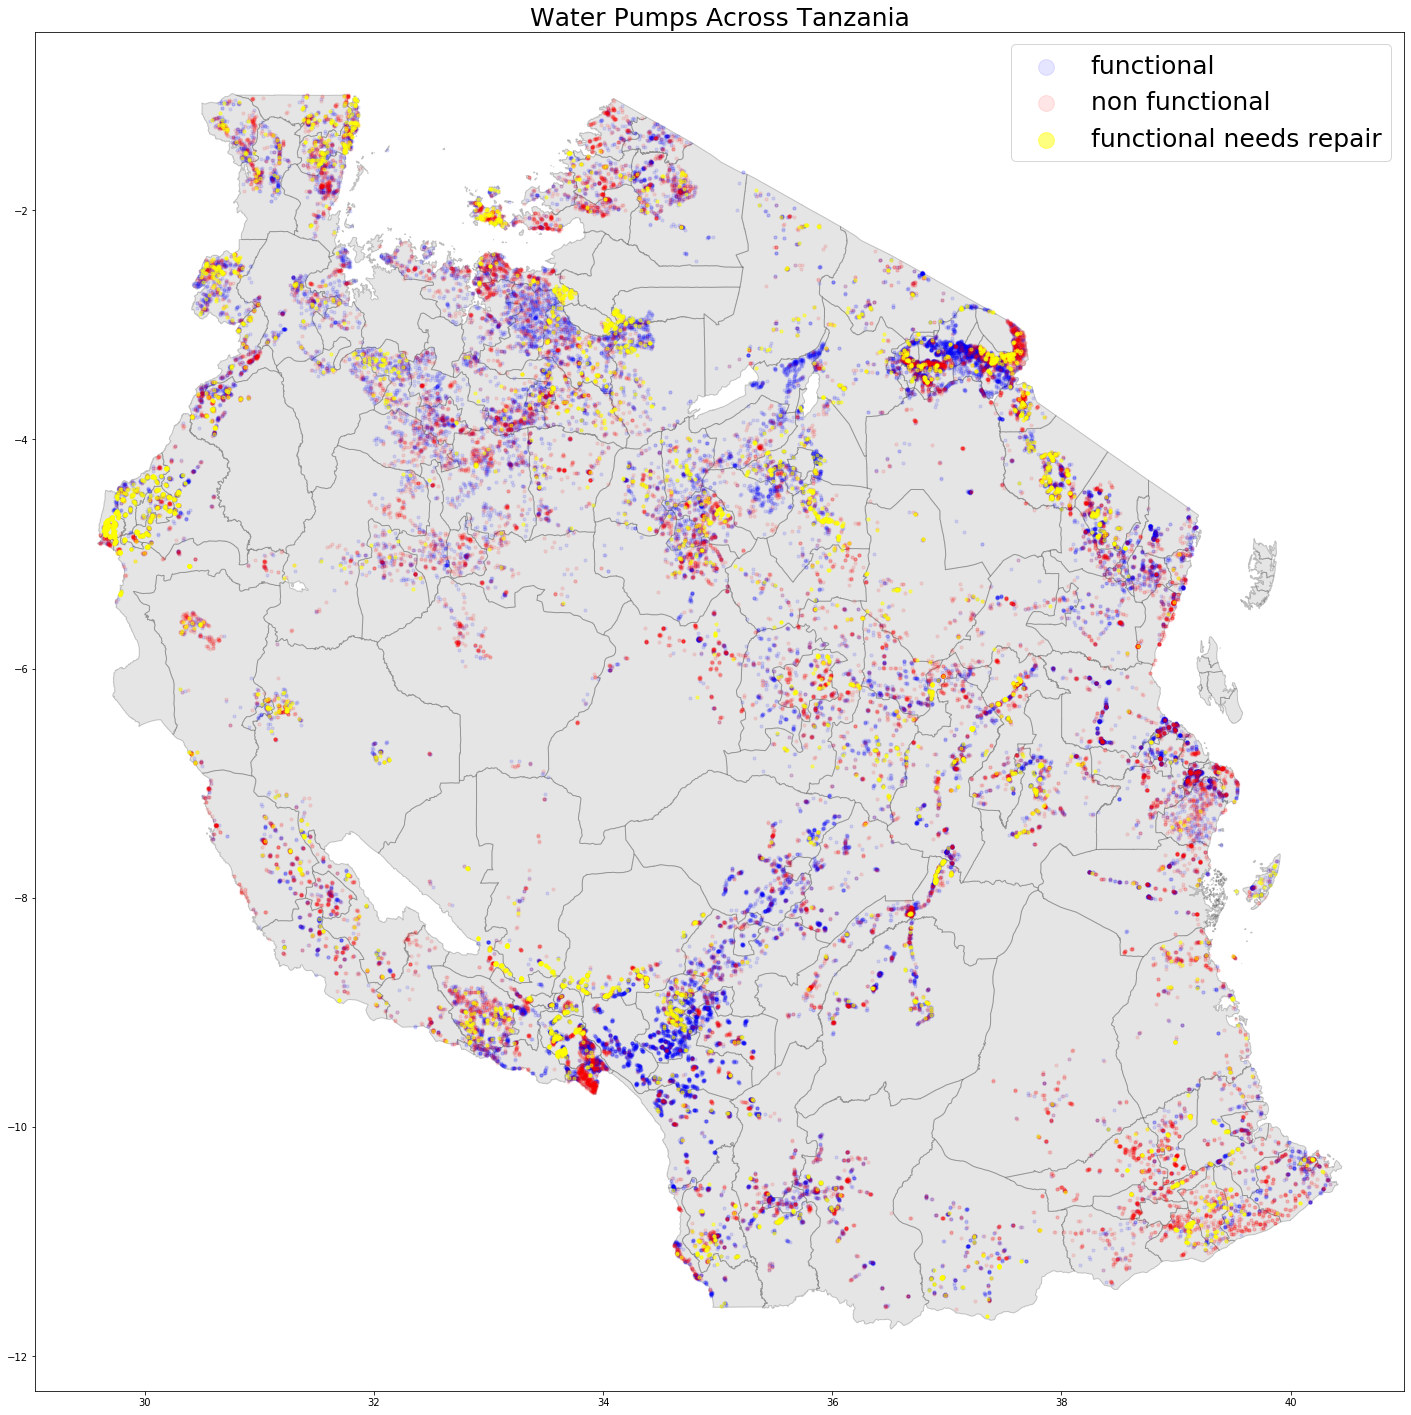
Water Pump Predictor
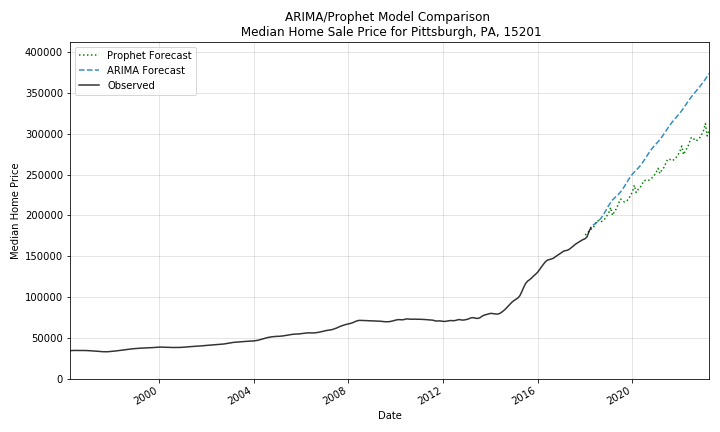
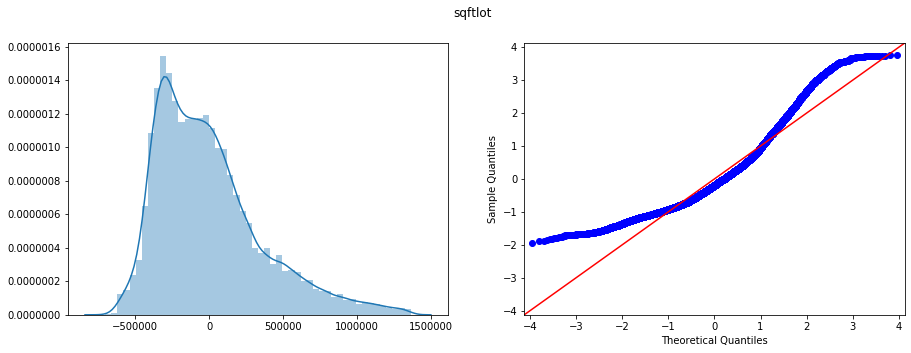
King County Housing
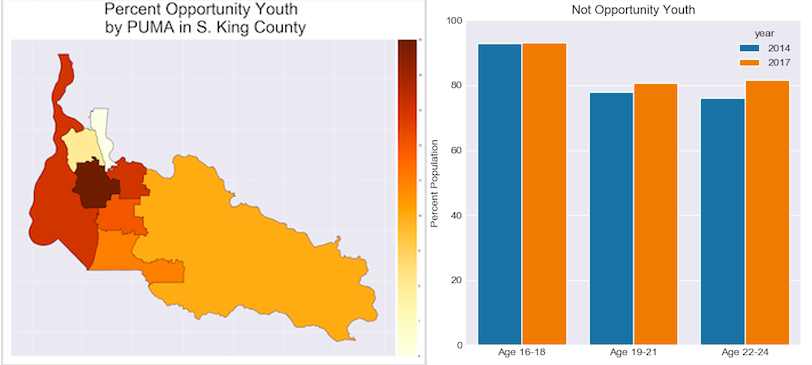
Opportunity Youth
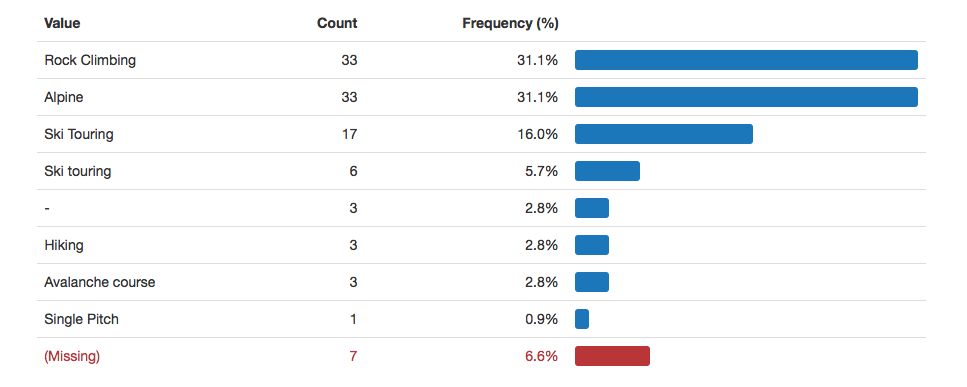
Stratiform Mountain Guides 2019 Buisiness Analysis
I practiced basic EDA to create a report that communicates a broad picture of a small data set. The data set was a database tracking the work of my previous business. The final product is an HTML display of the descriptive statistics of each variable contained within the data set. I used Python, Pandas, Pandas Profiling, Matplotlib, HTML, and CSS for this project.